Image Details
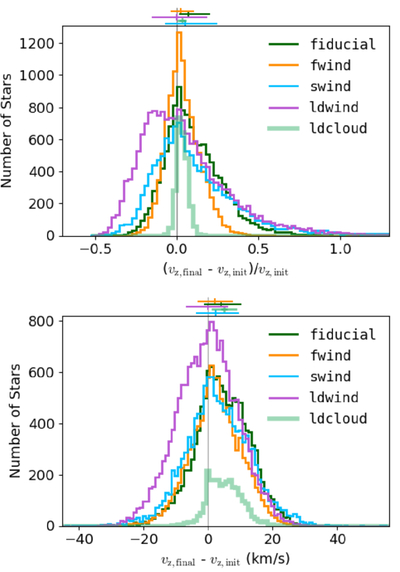
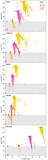
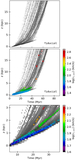
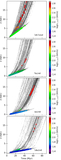
Caption: Figure 10.
Histograms of the ratio of the velocity change, measured as the difference between the particle velocity at the final output at 100 Myr (vz,final) and the initial (formation) velocity of the particle (vz,init) to the initial velocity of star particles (top panel) and the measured velocity change of star particles (bottom panel), in the simulations as labeled. The gray vertical line is at zero change, and above each panel we plot the median and interquartile range for each run (the lines are offset vertically for clarity). The velocity of most stars shows little change over the course of any of the runs, with a tendency for the velocity to increase in the wind direction (positive median values). The width of the distribution in both the upper and lower panels increases for the runs with lower ram pressure (swind and ldwind), whose dense gas clouds stay coherent for a longer time.
Other Images in This Article
Show More
Copyright and Terms & Conditions
© 2026. The Author(s). Published by the American Astronomical Society.