Image Details
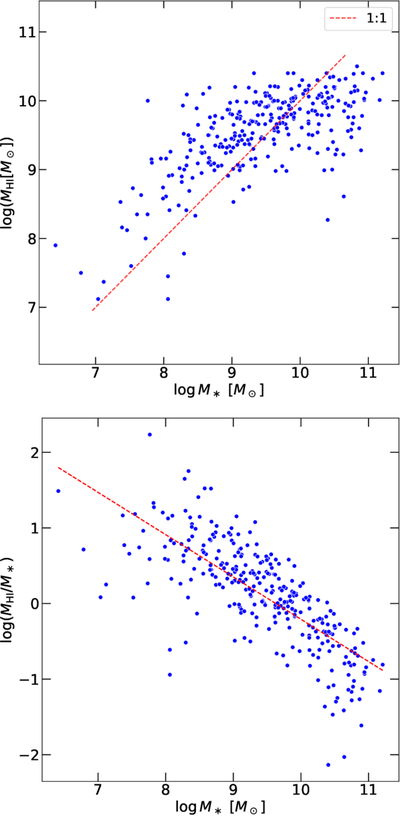
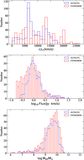
Caption: Figure 7.
Top: correlations between the stellar mass M* and H I mass MH I. Bottom: H I mass fraction as a function of the stellar mass M*. The red line in the upper panel is the 1:1 line, and the red line in the lower panel is the line by fitting the data with the Y = AX + B function. The results shown here are for galaxies with code 1, 2, and 3.
Other Images in This Article

Show More
Copyright and Terms & Conditions
© 2026. The Author(s). Published by the American Astronomical Society.
Copyright ©
2026 Astronomy Image Explorer. All Rights Reserved.