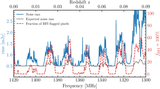
Image Details
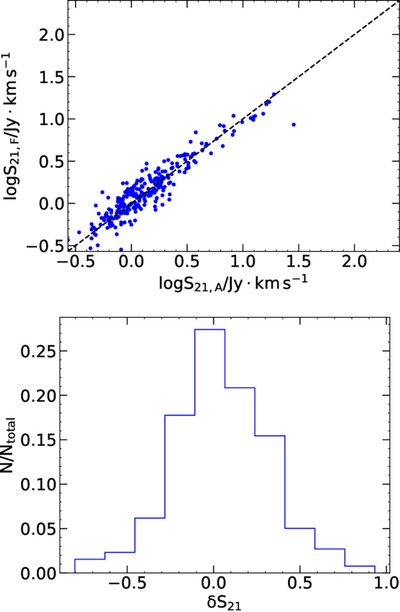
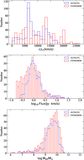
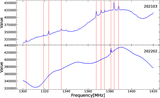
Caption: Figure 4.
Top: comparison of the flux between FATHOMER and ALFALFA. The black dashed line represents the equality of two fluxes from two different surveys. All galaxies shown here have S/N > 10. Bottom: histogram of δS21.
Other Images in This Article

Show More
Copyright and Terms & Conditions
© 2026. The Author(s). Published by the American Astronomical Society.
Copyright ©
2026 Astronomy Image Explorer. All Rights Reserved.