Image Details
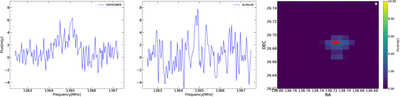
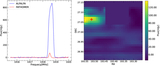
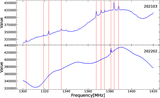
Caption: Figure 3.
Frequency spectra for galaxy AGCNr 191363 in FATHOMER (left) and ALFALFA (middle). The right panel is the sky map in FATHOMER. The signal in ALFALFA is relatively weak, with S/N = 4.3. In FATHOMER, we get a higher S/N (S/N = 6.3) and confirm that this signal should be real.
Other Images in This Article

Show More
Copyright and Terms & Conditions
© 2026. The Author(s). Published by the American Astronomical Society.
Copyright ©
2026 Astronomy Image Explorer. All Rights Reserved.