Image Details
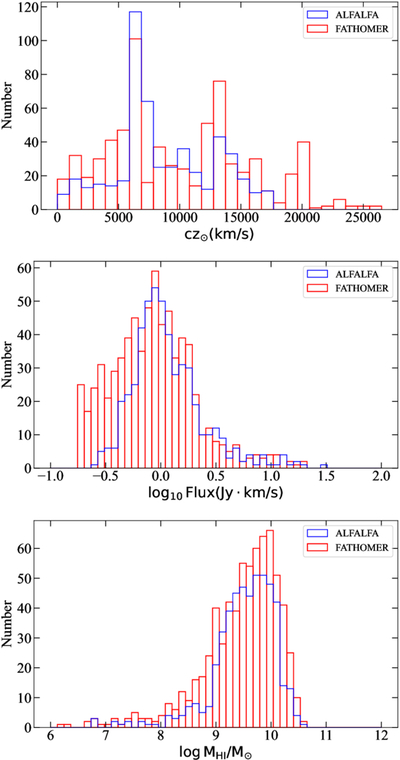
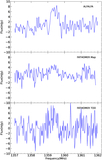
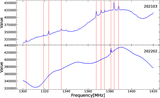
Caption: Figure 6.
Top: histograms of the measured heliocentric velocity (cz⊙). Middle: histograms of the measured H I flux. Bottom: histograms of the measured H I mass. The results of the ALFALFA and the FATHOMER galaxy samples in the same sky area are shown in blue and red, respectively.
Other Images in This Article

Show More
Copyright and Terms & Conditions
© 2026. The Author(s). Published by the American Astronomical Society.
Copyright ©
2026 Astronomy Image Explorer. All Rights Reserved.