Image Details
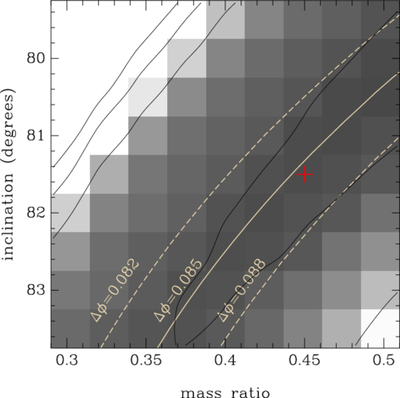
Caption: Figure 2.
Entropy landscape in the (i, q) binary parameter plane. The entropy of the eclipse maps is shown as different shades of gray; darker regions have higher entropy. Contour lines indicate the shape of the entropy landscape, and a red cross marks the location of the highest entropy. White curves show lines of constant Δϕ values.
Other Images in This Article
Copyright and Terms & Conditions
© 2026. The Author(s). Published by the American Astronomical Society.
Copyright ©
2026 Astronomy Image Explorer. All Rights Reserved.