Image Details
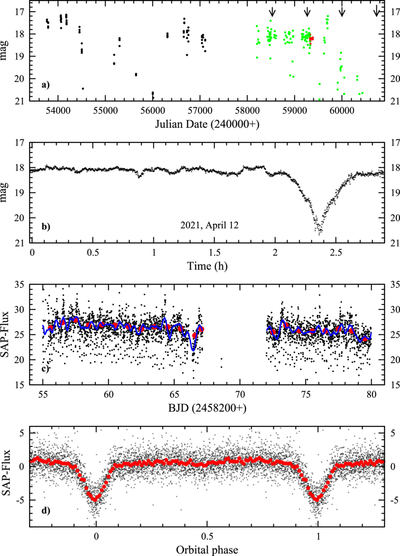
Caption: Figure 1.
(a) Long-term light curve of CRTS 0934. Black and green dots are CRTS and ZTF data, respectively. The red dots represent the nightly average out-of-eclipse magnitude of the OPD observations. The black arrows indicate mid-epochs of the TESS data. (b) Time-resolved OPD light curve of 2021, April 12 (starting just before midnight of April 11). (c) Sector 35 TESS light curve. The red dots are average flux values (after masking eclipses) within 1 day intervals. The light curves smoothed with a Savitzky–Golay filter (again, eclipses masked) are shown in blue. (d) Combined TESS light curve of sectors 8 and 35, folded on the orbital period (small black dots). The red dots represent average values in phase bins of width 0.01.
Other Images in This Article
Copyright and Terms & Conditions
© 2026. The Author(s). Published by the American Astronomical Society.