Image Details
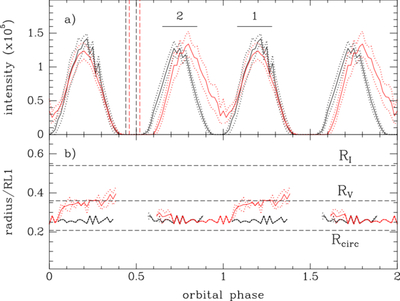
Caption: Figure 4.
(a) Dependency on orbital phase of the maximum intensity derived from the asymmetric component of the V-band (black) and I-band (red) eclipse maps. Intensities are plotted on an arbitrary scale; arms 1 and 2 are labeled, and horizontal tick marks indicate the phases of maxima of the double-wave orbital modulation. Dotted lines show the uncertainties at the 1σ limit. Vertical dashed lines mark the 1σ range of values for the phase of lowest intensity, ﹩{\phi }_{1}({I}_{{\rm{\min }}})﹩ (see text). (b) Corresponding radius of maximum intensity in units of RL1. Horizontal dashed lines mark the circularization radius (Rcirc = 0.208 RL1) and the outer disk radius (RV = 0.36 RL1 in the V band and RI = 0.54 RL1 in the I band).
Other Images in This Article
Copyright and Terms & Conditions
© 2026. The Author(s). Published by the American Astronomical Society.