Image Details
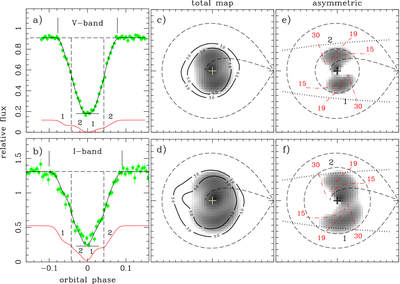
Caption: Figure 3.
Left-hand panels: average data (green points with error bars) and best-fit eclipse mapping model (solid line) for the V-band (a) and I-band (b) light curves. Horizontal bars at mid-eclipse show the uneclipsed flux in each case. Vertical dashed lines mark the best-fit Δϕ value (indicating the WD ingress/egress phases), and vertical ticks mark the total width of the eclipse, ΔϕE. The lower red curve illustrates the eclipse light curve of the asymmetric arcs 1 and 2 (see text). Middle panels: V-band (c) and I-band (d) eclipse maps in a logarithmic gray scale; darker regions are brighter. Regions inside the two solid contour lines are above the 3σ and 5σ confidence levels, respectively. A cross marks the position of the disk center; dashed lines depict the primary Roche lobe and the gas stream trajectory. Right-hand panels: the asymmetric component of the V-band (e) and I-band (f) eclipse maps in a logarithmic gray scale. Dashed circles mark the estimated disk radii; dotted lines show the edge of the projected shadow of the secondary star at phase zero, while dotted–dashed red lines illustrate the expected orientation of tidally induced spiral arms for constant opening angles of θs = 15°, 19°, and 30°. The location of asymmetric arcs 1 and 2 is indicated.
Other Images in This Article
Copyright and Terms & Conditions
© 2026. The Author(s). Published by the American Astronomical Society.