Image Details
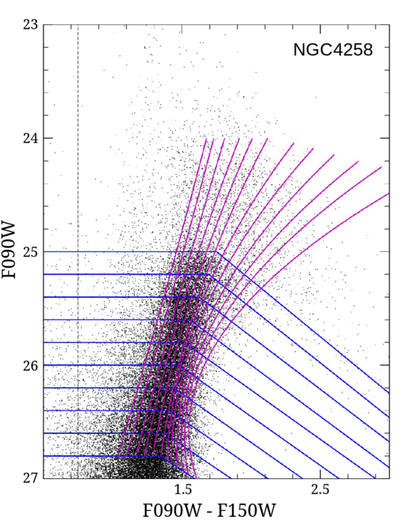
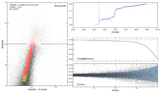
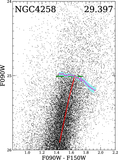
Caption: Figure 5.
Segmentation of an RGB CMD into color strips bounding individual maximum-likelihood tests. Representative magenta lines are shown. Details are discussed in Appendix A.
Other Images in This Article
Show More
Copyright and Terms & Conditions
© 2026. The Author(s). Published by the American Astronomical Society.
Copyright ©
2026 Astronomy Image Explorer. All Rights Reserved.