Image Details
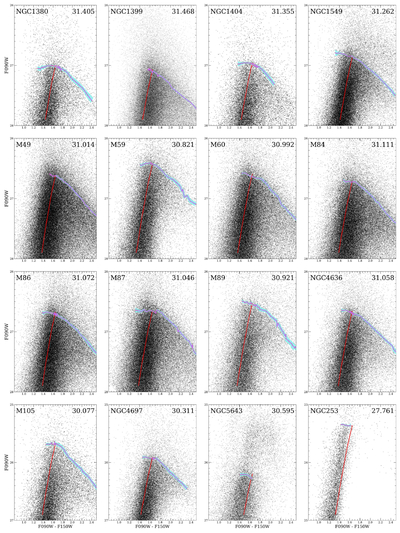
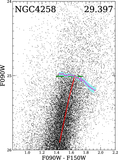
Caption: Figure 10.
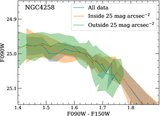
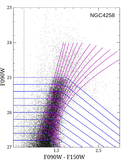
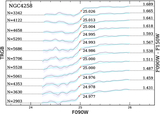
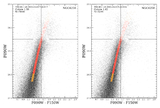
Color relations for all the galaxies except NGC 4258. As in Figure 9, cyan curves illustrate the TRGB limits as a function of (F090W − F150W)0 colors. The isochrone for 10 Gyr that ends where the TRGB color slope changes is shown in red.
Other Images in This Article
Show More
Copyright and Terms & Conditions
© 2026. The Author(s). Published by the American Astronomical Society.
Copyright ©
2026 Astronomy Image Explorer. All Rights Reserved.