Image Details
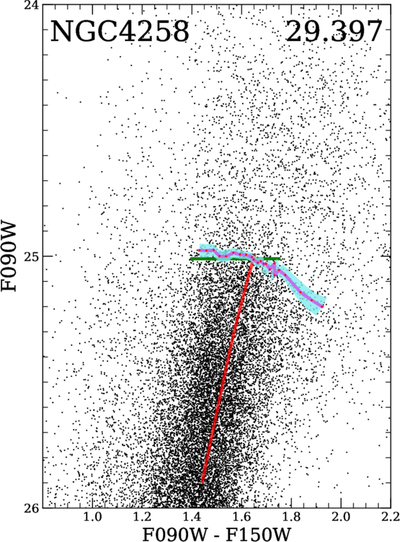
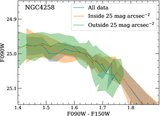
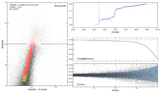
Caption: Figure 9.
TRGB fit as a function of color for the galaxy NGC 4258. The running mean of slices as a function of color are shown by the magenta line with cyan band uncertainties. The red band is the RGB isochrone for a 10 Gyr population with [M/H] = − 0.57. The green constant value line at F090W0 = 25.01 corresponds to the fit by G. S. Anand et al. (2024a) with revised photometry and after adjustment for reddening.
Other Images in This Article
Show More
Copyright and Terms & Conditions
© 2026. The Author(s). Published by the American Astronomical Society.
Copyright ©
2026 Astronomy Image Explorer. All Rights Reserved.