Image Details
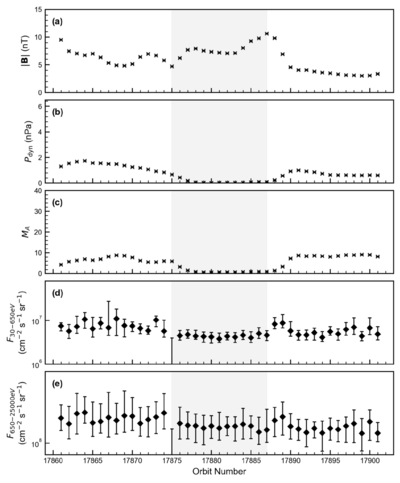
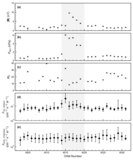
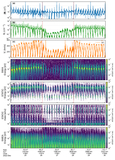
Caption: Figure 9.
Orbit-by-orbit variations of solar wind parameters and ion precipitation fluxes for DSW event. The horizontal axis shows MAVEN orbit number. From top to bottom, the panels display (a) the magnetic field strength, (b) solar wind dynamic pressure, (c) Alfvén Mach number, (d) low-energy ion precipitation flux (30–650 eV), and (e) high-energy ion precipitation flux (650–25,000 eV). The shaded region indicates the period of the event.
Other Images in This Article
Copyright and Terms & Conditions
© 2026. The Author(s). Published by the American Astronomical Society.
Copyright ©
2026 Astronomy Image Explorer. All Rights Reserved.