Image Details
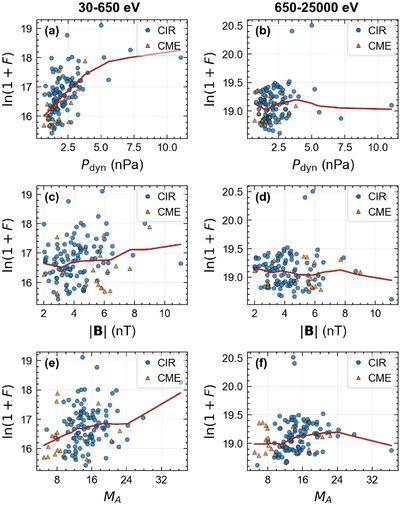
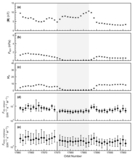
Caption: Figure 7.
Statistical relationships between solar wind parameters and ion precipitation fluxes across all extreme events. The figure consists of six panels arranged in three rows: (a) low-energy ion precipitation flux (30–650 eV) expressed as ﹩\mathrm{ln}(1+F)﹩ versus solar wind dynamic pressure Pdyn; (b) high-energy ion precipitation flux (650–25,000 eV) ﹩\mathrm{ln}(1+F)﹩ versus Pdyn; (c) ﹩\mathrm{ln}(1+F)﹩ for low-energy ions versus ∣B∣; (d) ﹩\mathrm{ln}(1+F)﹩ for high-energy ions versus ∣B∣; (e) ﹩\mathrm{ln}(1+F)﹩ for low-energy ions versus MA; (f) ﹩\mathrm{ln}(1+F)﹩ for high-energy ions versus MA. The scatter plots (dots) display median-based event data, and solid (or dashed) lines indicate the fitted trends. We plot precipitation fluxes as ﹩\mathrm{ln}(1+F)﹩ to compress the large dynamic range, reduce skewness and the influence of extreme values, and to ensure the quantity is defined when F = 0.
Other Images in This Article
Copyright and Terms & Conditions
© 2026. The Author(s). Published by the American Astronomical Society.