Image Details
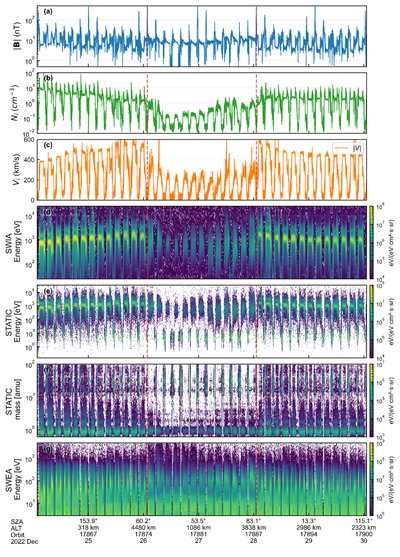
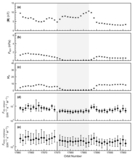
Caption: Figure 8.
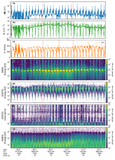
Overview of the DSW event. From top to bottom, the subpanels show (a) the magnetic field magnitude measured by MAG, (b) the ion density derived from SWIA, (c) the ion bulk velocity from SWIA, (d) the SWIA omnidirectional ion energy spectrum, (e) the STATIC ion energy spectrum, (f) the STATIC mass spectrogram, and (g) the SWEA electron energy spectrum. The event interval is marked by a vertical red dashed line.
Other Images in This Article
Copyright and Terms & Conditions
© 2026. The Author(s). Published by the American Astronomical Society.
Copyright ©
2026 Astronomy Image Explorer. All Rights Reserved.