Image Details
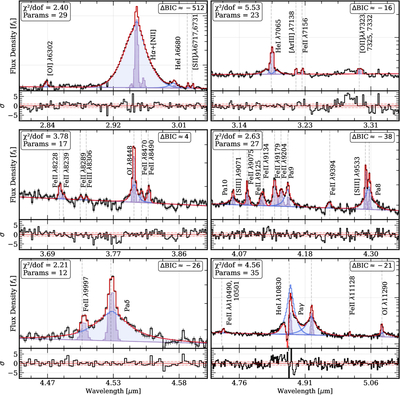
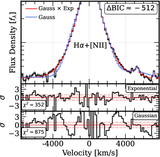
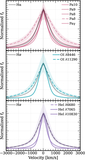
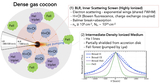
Caption: Figure 2.
A staggering abundance of spectral lines in GLIMPSE-17775 at z = 3.501. For each spectral window defined in Section 3.3, we show the data (black), the best-fit narrow and broad components (dark purple and blue), and the total best-fit model including the continuum (red). All broad components were fit with models allowing exponential wings. The ΔBIC between exponential and Gaussian fits is reported in the top right of each panel; negative values indicate a preference for an exponential profile. The lower panels display the uncertainty-weighted residuals for each fit.
Other Images in This Article
Copyright and Terms & Conditions
© 2026. The Author(s). Published by the American Astronomical Society.
Copyright ©
2026 Astronomy Image Explorer. All Rights Reserved.