Image Details
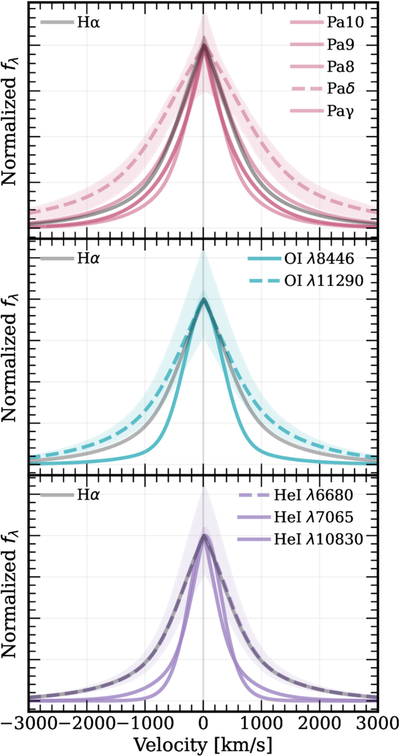
Caption: Figure 6.
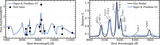
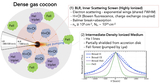
Best-fit profiles of all broad lines, oversampled and shifted to a common center. The top panel shows hydrogen recombination (Hα, black, and Paschen series), the middle panel shows O I, and the bottom panel shows He I. Shaded regions indicate 1σ uncertainties for the least-constrained lines (Paδ, O I λ11290, and He I λ6680); uncertainties for the remaining lines are omitted for clarity. We note that hydrogen and O I lines show largely similar widths, consistent with their coupling through charge exchange. By contrast, He I lines are systematically narrower, likely reflecting their distinct metastable triplet physics and formation in a less dense outer region.
Other Images in This Article
Copyright and Terms & Conditions
© 2026. The Author(s). Published by the American Astronomical Society.