Image Details
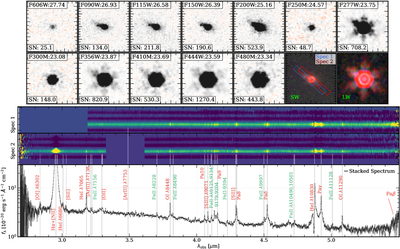
Caption: Figure 1.
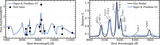
Top: JWST/NIRCam and HST 2﹩\mathop{.}\limits^{^{\prime\prime} }﹩0 stamps and red, green, blue short-wavelength (SW) and long-wavelength (LW) color images, comprising the F115W, F150W, and F200W and F277W, F356W, and F444W bands, respectively. MSA shutters for both configurations covering GLIMPSE-17775 are shown in blue and red, respectively. The source morphology is resolved and extended up to ∼2 μm, and then appears to transition to a more PSF-dominated and compact shape, echoing a growing sample of LRDs with extended rest-UV morphology (I. Juodžbalis et al. 2024; I. Labbe et al. 2024; J. Matthee et al. 2024; P. Rinaldi et al. 2025a). This likely hints at the presence of the host galaxy in the filters covering the rest-UV. In each panel, we show the total AB magnitude as presented in the GLIMPSE catalog (H. Atek et al. 2025; V. Kokorev et al. 2025). The source is exceptionally bright (M444 ∼ 23.6) and is detected in most JWST bands at >100σ. Middle: two-dimensional MSA G395M spectra covering GLIMPSE-17775. Bottom: combined one-dimensional spectrum (see, e.g., V. Kokorev et al. 2023; A. de Graaff et al. 2025a for the extraction method) of the LRD in the observed frame. We show the data in black, and the uncertainty as a black shaded region. Fixing the systemic redshift to the [S III] λ9071 line (zspec = 3.50102 ± 0.00019), we show the positions and label the prominent emission with significant (≥3σ) detections as solid vertical lines. Iron lines are shown separately in green. Due to the sheer number of features, not all could be labeled; we therefore display all features in Figure 2. Emission lines for which only upper limits are obtained are shown with dashed lines.
Other Images in This Article
Copyright and Terms & Conditions
© 2026. The Author(s). Published by the American Astronomical Society.