Image Details
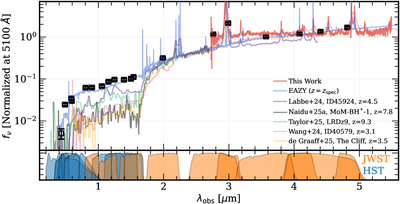
Caption: Figure 3.
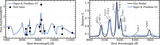
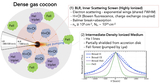
The diversity of Balmer breaks in LRDs. The black points show the HST and JWST GLIMPSE photometry of GLIMPSE-17775. The blue line shows best-fit EAZY SED fit to the photometry only, fixing the redshift to the zspec. The maroon line show the combined and photometry-corrected G395M spectrum. While the red color in F200W–F277W is partially influenced by a bright Hα line, the Balmer break between F150W and F200W is still prominent. We further show spectra of various other LRDs (I. Labbe et al. 2024; B. Wang et al. 2024; A. de Graaff et al. 2025b; R. P. Naidu et al. 2025; A. J. Taylor et al. 2025), all shifted to z = 3.501 and normalized at 5100 Å. Finally, we show HST (blue) and JWST (orange) filter transmission curves below.
Other Images in This Article
Copyright and Terms & Conditions
© 2026. The Author(s). Published by the American Astronomical Society.