Image Details
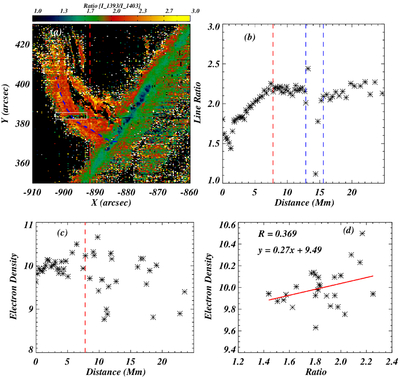
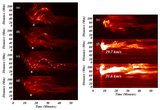
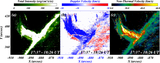
Caption: Figure 10.
Panel (a) shows the intensity ratio of the Si IV (i.e., 1403/1399) map of the observed region. Most of the locations within the jet region have a ratio value close to the theoretical ratio value (i.e., 2). The path is drawn along the jet (blue-dashed path in panel (a)), and the ratio along this path is shown in panel (b). The ratio value starts around 1.5 (at the limb) and increases further, reaching close to 2 at a height of about 7.8 Mm. This particular location is indicated by red vertical dashed lines in panels (a) and (b). After this height, the ratio becomes almost constant at around 2. The region enclosed by blue vertical lines in panel (b) belongs to the region where the spectra were of poor quality (i.e., unusable spectra), and the same region is outlined by a white rectangular box in panel (a). Further, panel (c) shows the electron density along the jet (i.e., along the blue slits), and the correlation of line ratio with electron density, below the height of 7.8 Mm (i.e., red vertical slit), is displayed in panel (d).
Other Images in This Article
Show More
Copyright and Terms & Conditions
© 2026. The Author(s). Published by the American Astronomical Society.