Image Details
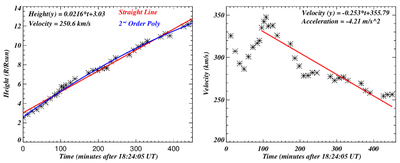
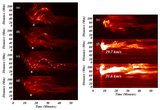
Caption: Figure 12.
Left panel: the height of the CME against time. The red and blue curves are the line and the second-order polynomial fit to the data points. The linear fit equation is shown at the top of the panel, and using the slope, we found that the velocity is around 250 km s−1. The right panel shows the velocity of the CME with time. First, the velocity increases, and later it decreases. The deceleration phase is fitted with a straight line (see the red line). Using this, the deceleration is estimated as being −4.21 km s−2.
Other Images in This Article
Show More
Copyright and Terms & Conditions
© 2026. The Author(s). Published by the American Astronomical Society.
Copyright ©
2026 Astronomy Image Explorer. All Rights Reserved.