Image Details
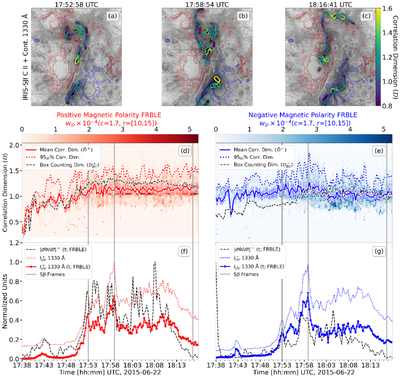
Caption: Figure 3.
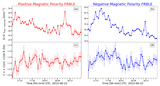
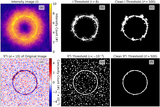
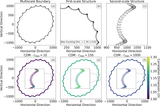
Evolution of FRBLE complexity and reconnection proxies. (a)–(c) Example frames (same as Figures 2(a5), (b5), and (c5)) showing ﹩{ \mathcal D }﹩ along the FRBLE at 17:52, 17:58, and 18:16 UT. Contours show HMI Bz levels: +500/+1000 G (red), −500/ − 1000 G (blue), and 0 G (white). (d) and (e) Distributions ﹩{w}_{{ \mathcal D }}﹩ for the positive and negative polarity ribbons. Solid lines show the mean ﹩\bar{{ \mathcal D }}﹩, dotted lines show the 95th percentile, and black dashed lines show the box-counting dimension ﹩{{ \mathcal D }}_{{{\rm{BC}}}}﹩. (f) and (g) Time series reconnection dynamics proxies in positive and negative magnetic polarity FRBLEs, respectively. The solid and dashed colored lines (red and blue) represent the 1330 Å intensity emitted from the FRBLE and full SJI FOV, respectively, while the black dashed line shows the cumulative reconnection rate derived from FRBLE observations. Vertical gray lines mark the times in (a)–(c).
Other Images in This Article
Copyright and Terms & Conditions
© 2026. The Author(s). Published by the American Astronomical Society.