Image Details
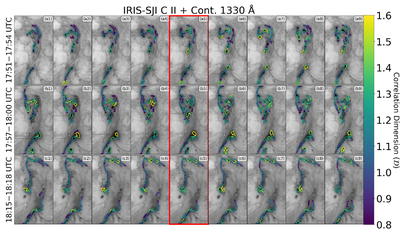
Caption: Figure 2.
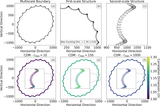
Spatial evolution of the FRBLE boundaries and local correlation dimension (﹩{ \mathcal D }﹩) over IRIS 1330 Å SJI. Images are shown as ﹩{{\mathrm{log}}}_{10}﹩ intensity (I*; 1–104 DN; reversed gray scale). Rows (a1)–(a9), (b1)–(b9), and (c1)–(c9) show nine consecutive IRIS frames during 17:51–17:53, 17:57–18:00, and 18:15–18:18 UT, respectively. Red boxes mark the middle frames: 17:52 UT (a5), 17:58 UT (b5), and 18:16 UT (c5). Colors show ﹩{ \mathcal D }﹩ along the FRBLE: higher values (yellow; ﹩{ \mathcal D }\gt 1.5﹩) indicate more corrugated/complex segments, while lower values (blue/dark; ﹩{ \mathcal D }\leqslant 1﹩) indicate smoother segments.
Other Images in This Article
Copyright and Terms & Conditions
© 2026. The Author(s). Published by the American Astronomical Society.