Image Details
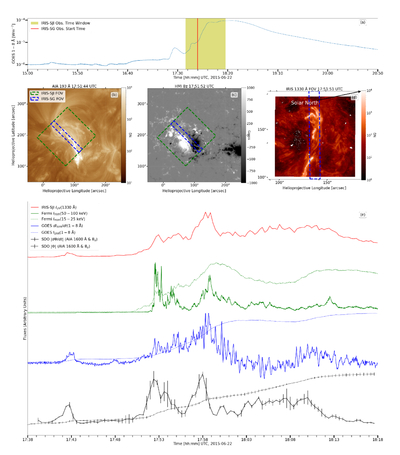
Caption: Figure 1.
Overview of the M6.5 flare in AR 12371 on 2015 June 22. (a) GOES 1–8 Å light curve; the IRIS-SJI analysis window is shaded yellow, and the IRIS-SG start time is marked by the vertical line. (b) AIA 193 Å image at 17:51 UT. (c) Corresponding HMI Bz magnetogram at 17:51 UT. (d) IRIS-SJI 1330 Å at 17:51 UT. Green and blue boxes show the SJI and SG FOVs, respectively. (e) Normalized time series of variables integrated over the respective FOVs: IRIS 1330 Å intensity (IUV; red), GOES 1–8 Å (ISXR; blue dashed) and its time derivative (dISXR/dt; blue solid), Fermi (IHXR) 15–25 keV (green dashed) and 50–100 keV (green solid), and ribbon-derived reconnection flux (Φ; black dashed) and rate (dΦ/dt; black solid).
Other Images in This Article
Copyright and Terms & Conditions
© 2026. The Author(s). Published by the American Astronomical Society.