Image Details
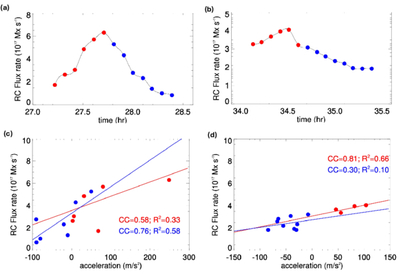
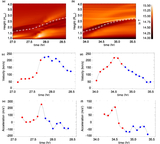
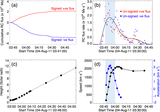
Caption: Figure 7.
Time evolution of RC rate (a)–(b). The RC flux is calculated by the magnetic flux passing through the footpoints of the field lines as well as through the CS shown in Figure 6(a). The red (blue) circles are used to represent simulation data before (after) the eruption. The smoothing is done by cubic spline. (c) CME RC rate vs acceleration plot for the first eruption. The red (blue) line is the linear fit to the points before (after) the eruption, respectively. (d) Same as (c), but for the second eruption.
Other Images in This Article
Copyright and Terms & Conditions
© 2026. The Author(s). Published by the American Astronomical Society.
Copyright ©
2026 Astronomy Image Explorer. All Rights Reserved.