Image Details
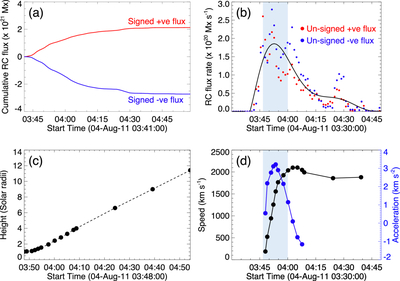
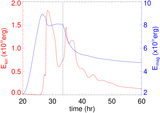
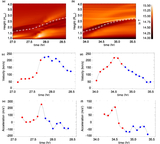
Caption: Figure 10.
(a) Time profile of signed cumulative RC flux integrated over the positive (red) and negative (blue) magnetic polarities underlying the flare ribbons. (b) Time profile of unsigned instantaneous RC flux integrated over the positive (red solid circles) and negative (blue solid circles) magnetic polarities underlying the flare ribbons. The black solid line is the fitted profile over all the data points, including the red and blue solid circles. (c) Height–time plot of the CME leading edge measured from STEREO EUVI, COR1, and COR2 for the same event as shown in Figure 8. (d) Velocity (in black) and acceleration (in blue) profiles of the CME leading edge derived from panel (c).
Other Images in This Article
Copyright and Terms & Conditions
© 2026. The Author(s). Published by the American Astronomical Society.