Image Details
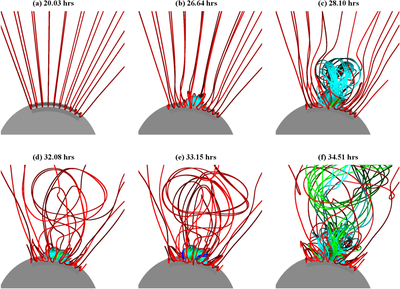
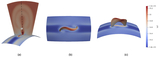
Caption: Figure 3.
The 3D evolution of the magnetic field of the twisted flux rope emerging into the corona at the specified times (in hours). Red field lines have footpoints in the ambient arcade, while blue (core), green (middle), and cyan (periphery) field lines originate from the emerging flux region at different distances from the flux rope axis. An animation of this evolution has a running time of 36 s. The period covered by the animation (in solar hours) spans from t = 19.65 to 40.25 hr from the start of the simulation. The flux rope starts emerging into the corona at t = 20.3 hr.
(An animation of this figure is available in the online article.)
(An animation of this figure is available.)
The video/animation of this figure is available in the online journal.
Other Images in This Article
Copyright and Terms & Conditions
© 2026. The Author(s). Published by the American Astronomical Society.