Image Details
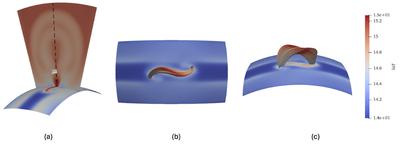
Caption: Figure 6.
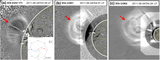
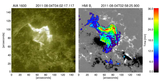
Identification of the CS and field lines of the flux rope from different viewing angles. The CS (in white) traced from the temperature isosurface with a value ﹩{\mathrm{log}}_{10}T=6.6﹩ is shown in panel (a). The height of the CS isosurface (white) from the lower boundary is about 1.4R⊙. The field lines passing through such sheets give the RC flux. The sigmoid field lines are shown in panels (b) and (c). The time in all these panels is at t = 27.32 hr.
Other Images in This Article
Copyright and Terms & Conditions
© 2026. The Author(s). Published by the American Astronomical Society.
Copyright ©
2026 Astronomy Image Explorer. All Rights Reserved.