Image Details
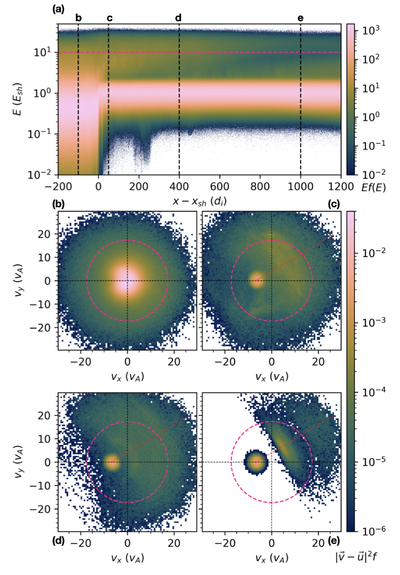
Caption: Figure 1.
(a) The reduced ion energy distribution for a 2di slice in the y-direction as a function of shock-normal direction and energy. (b)–(d) Ion distribution functions at the locations shown by the dashed lines in (a), scaled by ∣v − u∣2. The distribution functions are plotted in the vx, vy plane and integrated over the vz-direction. All the distribution functions are averaged in time over ﹩50{{\rm{\Omega }}}_{\mathrm{ci}}^{-1}﹩ at ﹩0.5{{\rm{\Omega }}}_{\mathrm{ci}}^{-1}﹩ intervals and are determined in the shock frame.
Other Images in This Article
Copyright and Terms & Conditions
© 2026. The Author(s). Published by the American Astronomical Society.
Copyright ©
2026 Astronomy Image Explorer. All Rights Reserved.