Image Details
Caption: Figure 2.
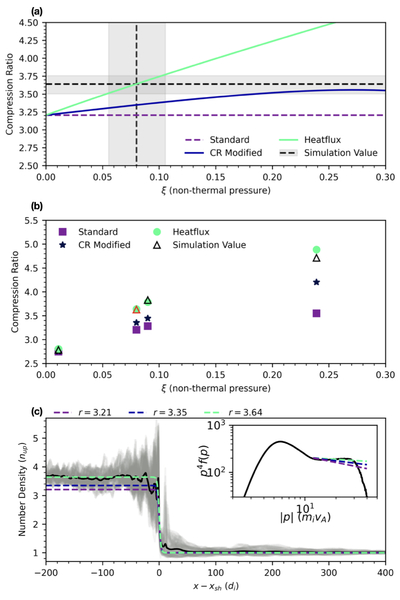
(a) Predictions for the shock compression ratio as a function of the normalized nonthermal pressure (ξ) from different theories as given in the legend. The black dashed lines show the simulation-measured nonthermal pressure (vertical) and compression ratio (horizontal), and the theory presented in this work in teal. (b) Scatter plot for the different compression ratio predictions for four different shock simulations as a function of measured nonthermal pressure (ξ) and Mach number. The red triangle denotes the simulation presented in the other figures. (c) The ion number density plotted as a function of shock-normal distance (time-averaged as in Figures 1 and 3). The inset shows the average downstream distribution function (multiplied by p4) as a function of momentum. The predicted nonthermal power-law indices are shown by the dashed lines based on standard DSA theory from the corresponding compression ratios.
Other Images in This Article
Copyright and Terms & Conditions
© 2026. The Author(s). Published by the American Astronomical Society.