Image Details
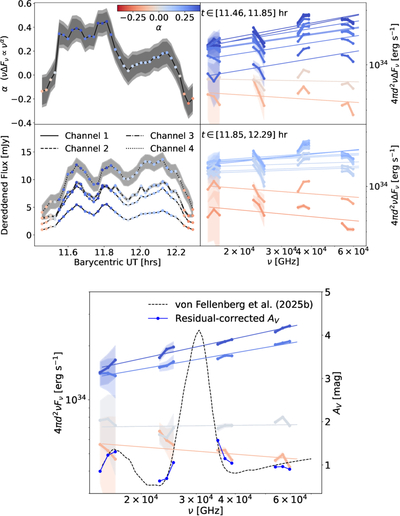
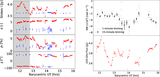
Caption: Figure 8.
Top: same as Figure 2 but without the residual extinction correction applied. Bottom: extinction curve published in the MIR Extinction Paper (black) and the residual-corrected extinction curve (blue) are compared. The residual extinction was calculated assuming Sgr A*’s SED is a power law during the flare. A few measurements of the corrected SED are also plotted.
Other Images in This Article
Copyright and Terms & Conditions
© 2026. The Author(s). Published by the American Astronomical Society.
Copyright ©
2026 Astronomy Image Explorer. All Rights Reserved.