Image Details
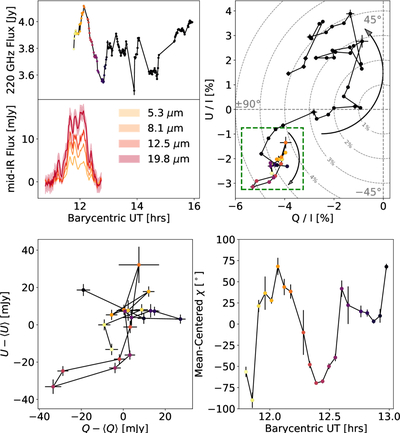
Caption: Figure 3.
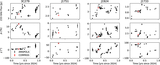
Top left: multiwavelength plot of SMA and dereddened JWST/MIRI light curves. Colored points in the SMA light curve correspond to the barycentric time of each 60 s point. Top right: time-resolved millimeter Stokes Q–U plot for Sgr A* obtained with the SMA at 192 s binning. Point colors correspond to the barycentric UT time in the top left panel. The green box corresponds to the zoom-in of the small Q–U loop during the third mid-IR peak, and arrows show the overall orientation of the two observed loops. Bottom left: mean-centered zoom-in of the CW-oriented Q–U loop before 13:00 UT at 192 s binning during the JWST/MIRI flare. Bottom right: EVPA of the mean-centered Stokes Q–U loop as a function of time, colored with the same scheme as the lower right panel.
Other Images in This Article
Copyright and Terms & Conditions
© 2026. The Author(s). Published by the American Astronomical Society.