Image Details
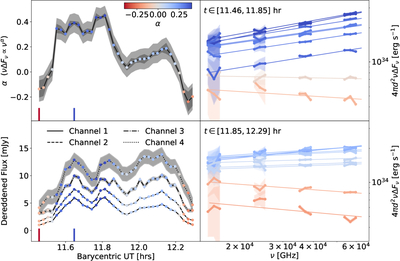
Caption: Figure 2.
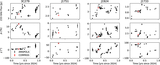
Temporal evolution of the mid-IR SED during the flaring event. Top left: spectral-index variations. The dark gray shaded region is the total statistical uncertainty, while lighter gray denotes the total statistical + systematic range. Bottom left: intrinsic mid-IR light curves of Sgr A* in all four channels; the gray shaded region shows the statistical photometric noise in the measurement. The red and blue vertical bars denote times at which the time-resolved SEDs are plotted in Figure 1. Right panels: residual-extinction-corrected SEDs (see Appendix C) at different times during the observation. Each MIRI/MRS channel has been broken up into three equally wide frequency bins (connected points), and a best-fit power-law (solid lines) has been plotted. Shaded regions correspond to the statistical uncertainty in the measurement. The colors of data points in all panels correspond to the measured spectral indices.
Other Images in This Article
Copyright and Terms & Conditions
© 2026. The Author(s). Published by the American Astronomical Society.