Image Details
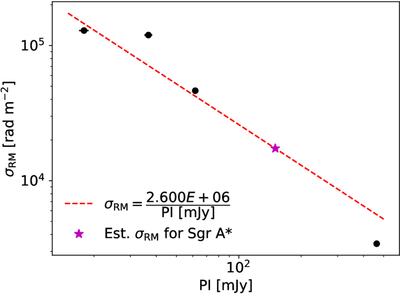
Caption: Figure 6.
Estimate of the thermal RM noise present in the SMA data (σRM) as a function of polarized flux density for the four calibrators (black points). The best-fit σRM ∝ PI−1 is plotted in red, and the purple star is the estimated thermal RM noise for Sgr A*.
Other Images in This Article
Copyright and Terms & Conditions
© 2026. The Author(s). Published by the American Astronomical Society.
Copyright ©
2026 Astronomy Image Explorer. All Rights Reserved.