Image Details
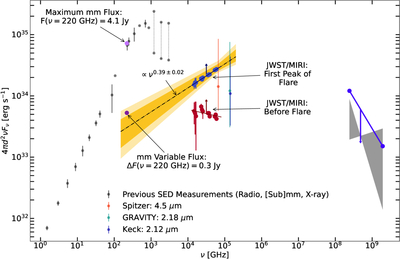
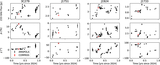
Caption: Figure 1.
Radio to X-ray SED of Sgr A*, including mid-IR JWST/MIRI lower limits (red and blue points; corresponding times are denoted in Figure 2), observed absolute maximum (light purple point) and variable (purple point) millimeter fluxes measured with the SMA, and X-ray flare upper limit from Chandra (blue-violet line) during this event. The first mid-IR peak’s best-fit power law is extrapolated, and the 68% (dark gold) and 90% (light yellow) credible intervals are plotted. The variable millimeter data are fully within the 90% credible range of the single power law stretching between millimeter to mid-IR. The binned, historic SED data are shown in the radio and millimeter (G. C. Bower et al. 2015, 2019; C. D. Brinkerink et al. 2016; H. B. Liu et al. 2016), far-IR (J. M. Stone et al. 2016; S. D. von Fellenberg et al. 2018), and X-ray (quiescent “bow-tie” spectrum; F. K. Baganoff et al. 2003). Spitzer (G. Witzel et al. 2018), GRAVITY (GRAVITY Collaboration et al. 2020a), and post-2019 Keck (G. C. Weldon et al. 2023) points show the median flux and 5%–95% percentile ranges. We have recalculated the ordinate using a standard distance of d = 8.178 kpc; for the Spitzer data, we have dereddened the data with the extrapolated extinction from the MIR Extinction Paper, A4.5 μm = 1.14 mag.
Other Images in This Article
Copyright and Terms & Conditions
© 2026. The Author(s). Published by the American Astronomical Society.