Image Details
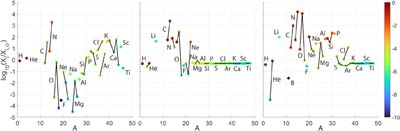
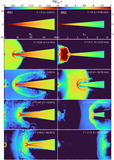
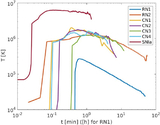
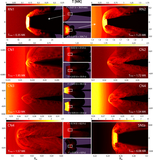
Caption: Figure 12.
Overproduction factors in the ejecta relative to solar abundances, vs. mass number for models RN1 and RN2 (left), CN1 and CN2 (middle), and CN3 and CN4 (right). The color map shows the mass fractions of the different isotopes in log scale.
Other Images in This Article
Show More
Copyright and Terms & Conditions
© 2025. The Author(s). Published by the American Astronomical Society.
Copyright ©
2026 Astronomy Image Explorer. All Rights Reserved.