Image Details
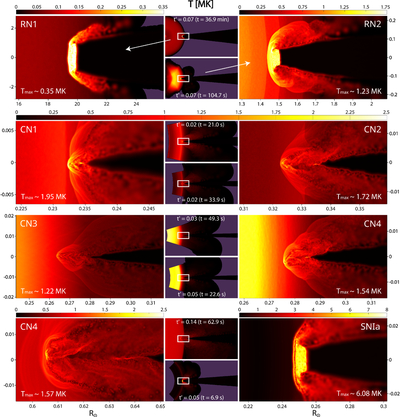
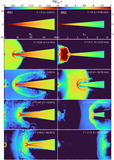
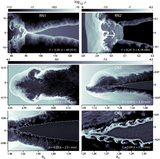
Caption: Figure 9.
Close-up snapshots at the moment of maximum temperature of the collisions (the horizontal axis corresponds to the position in solar radii, and the color map displays temperature in MK). Due to the high impact velocities, model CN4 reaches a second peak temperature later on owing to the formation of hydrodynamical instabilities. Notice the different appearance of the shocks in models RN1, RN2, and SN Ia when compared to those in the CN models: the high accretion rates result in the formation of thicker and more robust disks that oppose increased resistance, forming this bubble shock morphology.
Other Images in This Article
Show More
Copyright and Terms & Conditions
© 2025. The Author(s). Published by the American Astronomical Society.