Image Details
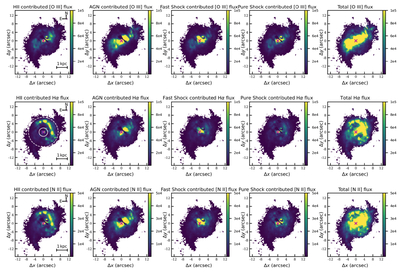
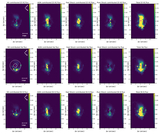
Caption: Figure 4.
2D maps of [O III] λ5007 (top panels), Hα (middle panels), and [N II] λ6584 (bottom panels) emission-line fluxes of the MUSE IFU data for NGC 5728. From left to right, each panel contains the emission-line flux maps contributed by H II, AGN, fast shocks, pure shocks, and the sum of all four mechanisms. The units of fluxes in this figure are × 10−20 erg s−1 cm−2. The spaxel with the highest [O III] luminosity, indicating the galaxy center, is marked with a magenta cross. The solid and dashed white circles in the H II–contributed Hα flux map indicate the nuclear region with a radius of 2″ and 6″, respectively.
Other Images in This Article
Copyright and Terms & Conditions
© 2025. The Author(s). Published by the American Astronomical Society.