Image Details
Caption: Figure 1.
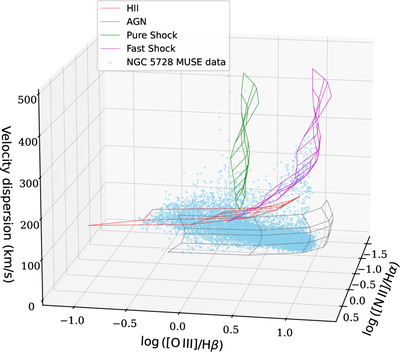
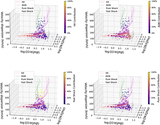
The distribution of MUSE IFU data for NGC 5728 on the new theoretical 3D diagram. The H II with log(P/k) = 6.0 and AGN models with ﹩{\mathrm{log}}\,(P/k)=7.4﹩ and ﹩{\mathrm{log}}\,({E}_{\mathrm{peak}}/\mathrm{keV})=-1.0﹩ are shown on the diagram in red and black grids that consist of constant metallicity lines (﹩12+{\mathrm{log}}\,({\rm{O}}/{\rm{H}})=8.12,8.42,8.82﹩ for H II model and ﹩12+{\mathrm{log}}\,({\rm{O}}/{\rm{H}})=8.43,8.70,8.80,9.02,9.26﹩ for AGN model) and constant ionization parameter lines (﹩{\mathrm{log}}\,({U})=-3.75,-3.5,-3.25,-3.0,-2.5,-2.25﹩ for H II model and ﹩{\mathrm{log}}\,({U})=-3.8,-3.4,-3.0,-2.6,-2.2﹩ for AGN model). The pure-shock and fast-shock models with ﹩{\mathrm{log}}\,(P/k)=10.2﹩ and ηM = 0.0001 are shown on the diagram in green and magenta grids with constant metallicity lines (﹩12+{\mathrm{log}}\,({\rm{O}}/{\rm{H}})=8.43,8.70,8.80,9.02,9.26﹩) and constant shock velocity lines (Vs = 158, 179, 202, 228, 257, 290, 328, 370, 418, 472 km s–1). The MUSE IFU data for NGC 5728 are shown with blue circles on the diagram. An interactive version of this figure is available in the online journal.
An interactive version of this figure is available in the online article.
An interactive version of this figure is available.
An interactive version of this figure is available in the online journal.
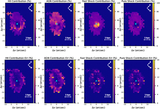
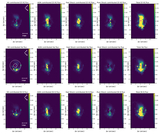
Other Images in This Article
Copyright and Terms & Conditions
© 2025. The Author(s). Published by the American Astronomical Society.