Image Details
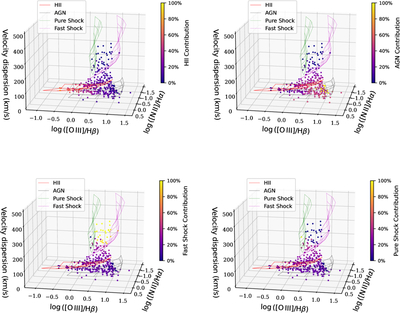
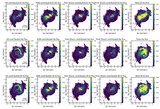
Caption: Figure 5.
The distribution of WiFeS IFU data for NGC 5728 (observed in the S7 survey) on the new theoretical 3D diagram, with the spaxels color-coded by H II contribution fraction (top left), AGN contribution fraction (top right), fast-shock contribution fraction (bottom left), and pure-shock contribution fraction (bottom right).
Other Images in This Article
Copyright and Terms & Conditions
© 2025. The Author(s). Published by the American Astronomical Society.
Copyright ©
2026 Astronomy Image Explorer. All Rights Reserved.