Image Details
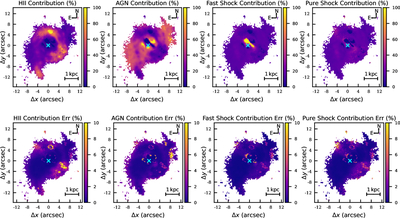
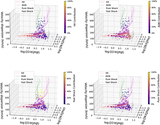
Caption: Figure 3.
2D maps of the MUSE IFU data for NGC 5728, with spaxels color-coded by fractional contribution in the top panels and the uncertainty in the bottom panels. From left to right, the distributions of H II contribution, AGN contribution, fast-shock contribution, and pure-shock contribution are shown. The spaxel with the highest [O III] luminosity, indicating the galaxy center, is marked with a cyan cross.
Other Images in This Article
Copyright and Terms & Conditions
© 2025. The Author(s). Published by the American Astronomical Society.
Copyright ©
2026 Astronomy Image Explorer. All Rights Reserved.