Image Details
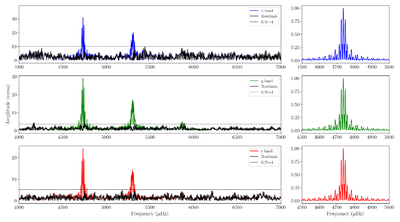
Caption: Figure 3.
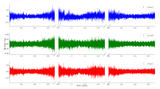
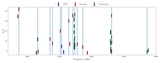
Fourier transforms of the combined ULTRACAM data set (shown in Figure 2) on WD J0049−2525. The u, g, and r-band data are shown in the top, middle, and bottom panels, respectively. The dashed horizontal line in each panel indicates the 4 × S/N detection threshold. The black line is the Fourier transform obtained after the prewhitening procedure discussed in the main text. The right panels display the spectral window for each light curve centered at 4737 μHz for a comparison.
Other Images in This Article
Copyright and Terms & Conditions
© 2025. The Author(s). Published by the American Astronomical Society.
Copyright ©
2025 Astronomy Image Explorer. All Rights Reserved.