Image Details
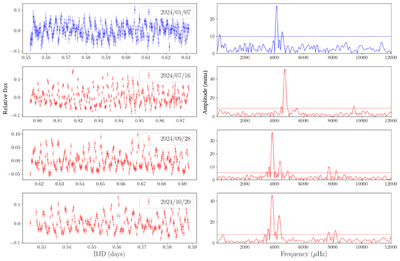
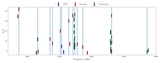
Caption: Figure 4.
Light curves (left panels) and corresponding FTs (right panels) for APO (blue) and Gemini (red) observations of WD J0049−2525. Dashed horizontal lines indicate the 4 × S/N detection threshold for each band. The observations are sorted chronologically and detailed in Table 2.
Other Images in This Article
Copyright and Terms & Conditions
© 2025. The Author(s). Published by the American Astronomical Society.
Copyright ©
2025 Astronomy Image Explorer. All Rights Reserved.