Image Details
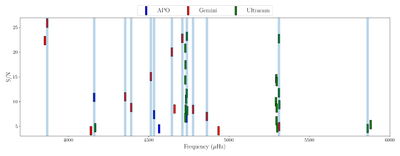
Caption: Figure 5.
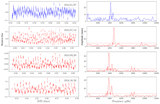
Frequency distribution of WD J0049−2525, color-coded by instrument (ULTRACAM in green, Gemini in red, and APO in blue), showing frequency as a function of S/N. The vertical lines represent the frequencies included in the seismic fit.
Other Images in This Article
Copyright and Terms & Conditions
© 2025. The Author(s). Published by the American Astronomical Society.
Copyright ©
2025 Astronomy Image Explorer. All Rights Reserved.