Image Details
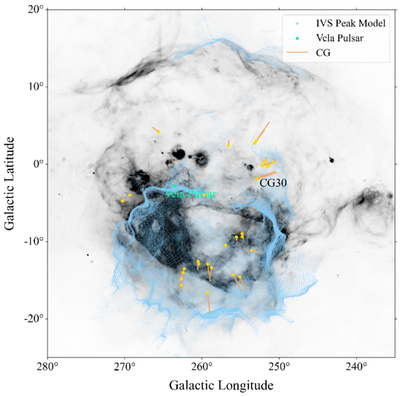
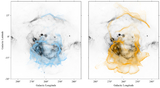
Caption: Figure 6.
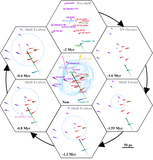
Spatial correlation between Hα (background grayscale; D. P. Finkbeiner 2003), the fiducial model of the IVS peak distribution, and the cometary globules (T. K. Sridharan 1992a). The CGs are represented by yellow heads and orange tails, with CG 30 labeled.
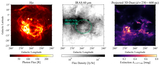
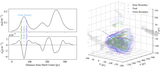
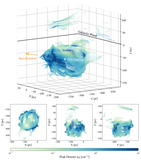
Other Images in This Article
Copyright and Terms & Conditions
© 2025. The Author(s). Published by the American Astronomical Society.
Copyright ©
2026 Astronomy Image Explorer. All Rights Reserved.