Image Details
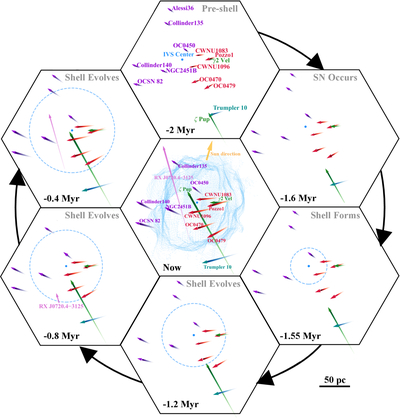
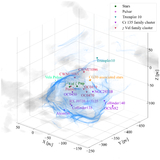
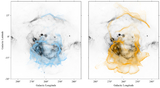
Caption: Figure 8.
A series of top-down views in the x–y plane, illustrating the relative locations of key objects in the vicinity of the IVS (the fiducial model of the IVS peak, colored in blue) in the LSR frame. Before the explosion of the supernova 1.6 Myr ago, the shell is marked with its center location. After its formation at −1.55 Myr (in the third panel), we keep the shell outline to guide the eye, while marking the shell expansion following R ∝ tη, as discussed in Section 5.2.4. For pulsar RX J0720.4-3125 which has no radial velocity constraints, we plot one scenario where it traverses the IVS; details are discussed in Section 5.2.6. The paths of two sets of nearby massive clusters that could have hosted supernovae in the past 3 Myr are shown in purple and red (see discussion in Section 5.2.7). The interactive version of this figure can be found here (https://annie-bore-gao.github.io/Images/gao24_fig8_interactive.html). Users can also switch to the view in the γ Vel cluster family frame (see Section 5.2.7) using the button within the interactive figure.
An interactive version of this figure is available in the online article.
An interactive version of this figure is available.
An interactive version of this figure is available in the online journal.
Other Images in This Article
Copyright and Terms & Conditions
© 2025. The Author(s). Published by the American Astronomical Society.