Image Details
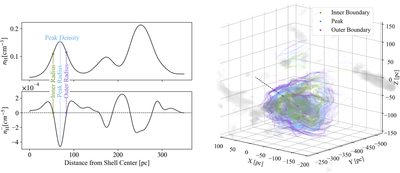
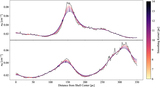
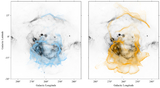
Caption: Figure 2.
Derivation of the IVS shell geometry. Left panels: the top panel displays an example of density profile nH, while the bottom panel shows the second derivative n″H, which is used to derive the shell boundaries. Right panel: inner shell radius (green), peak shell radius (blue), and outer shell radius (purple) of the IVS as derived in this work. The dashed line represents an example ray, which corresponds to the density profile shown on the left. For the rays exhibiting multiple peaks, our method (see Equations (2) and (3)) selects the first peak as the shell boundary.
Other Images in This Article
Copyright and Terms & Conditions
© 2025. The Author(s). Published by the American Astronomical Society.
Copyright ©
2026 Astronomy Image Explorer. All Rights Reserved.