Image Details
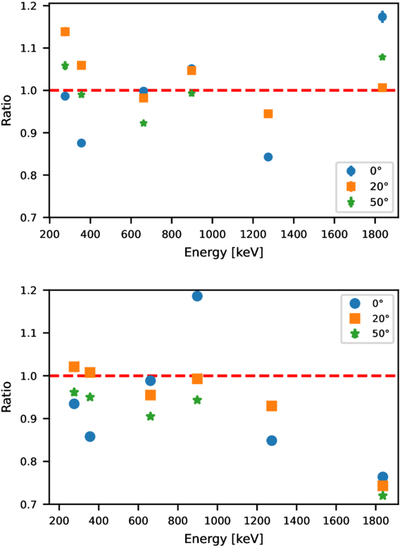
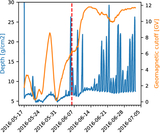
Caption: Figure 8.
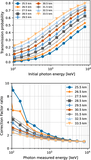
A comparison of the ratio of measured to simulated counts in different lines from the calibration campaign as a function of energy and off-axis angle. The top panel shows the PE events and the bottom panel shows the CO events. The statistical errors are plotted, but they are smaller than the points.
Other Images in This Article
Show More
Copyright and Terms & Conditions
© 2025. The Author(s). Published by the American Astronomical Society.
Copyright ©
2025 Astronomy Image Explorer. All Rights Reserved.