Image Details
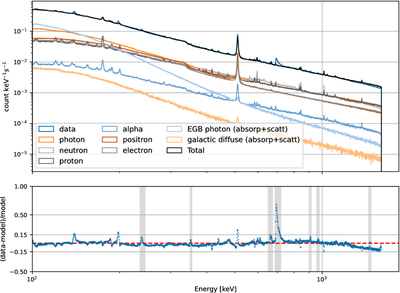
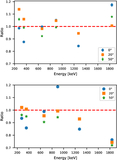
Caption: Figure 10.
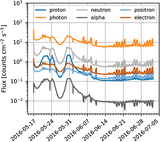
Top: spectra of the PE events for all components of the model. Bottom: residuals between data and total background model. The gray areas show activation lines present in the data but not in the simulations (or vice versa).
Other Images in This Article
Show More
Copyright and Terms & Conditions
© 2025. The Author(s). Published by the American Astronomical Society.
Copyright ©
2025 Astronomy Image Explorer. All Rights Reserved.