Image Details
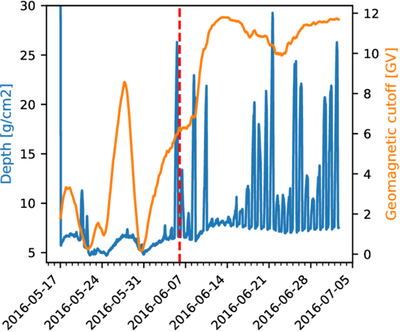
Caption: Figure 1.
Variation of the depth and latitude-dependent cutoff rigidity during the balloon flight. The red dashed line represents the starting date (2016 June 7) of the data set we present in Section 4. The spikes in the depth distribution are due to the drop of altitude of the balloon gondola during the nights.
Other Images in This Article
Show More
Copyright and Terms & Conditions
© 2025. The Author(s). Published by the American Astronomical Society.
Copyright ©
2025 Astronomy Image Explorer. All Rights Reserved.